Nevada Traffic Research & Education Newsletter
SEPTEMBER 30, 2026 // VOL. 15, ISSUE 04

When Every Minute Matters: Prehospital Blood & Post-Crash Care in Nevada
By: Blessing Imade, MPH; Selam Ayele, MPH(c); MS; Ana L. Reyes, MS; Noehealani Antolin, PhD, MPH; Darin Mains, MPH; Kavita Batra, PhD, MPH, BDS, FRSPH; Deborah A. Kuhls, MD FACS FCCM MCCM FRCST (Hon)
🩸 Prehospital Blood: Saving Lives Before the Hospital
Prehospital Blood Transfusion is the administration of whole blood or blood components to severely bleeding patients at the scene of an emergency or during transit to receive medical care [1].
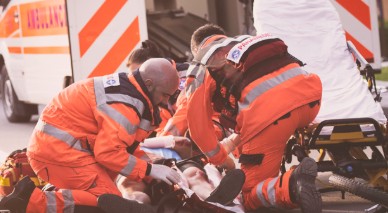
Figure 1: EMS Delivering Pre Hospital Blood. Image source: The Public Safety Group
Every Minute Counts in Severe Trauma
- #1 Cause: Severe bleeding is the top preventable cause of death in trauma-related injuries, such as motor-vehicle crashes [1, 2]. In 2023, nearly 41,000 people died from injuries sustained in motor-vehicle crashes. Unfortunately, nearly half of patients die before they reach the hospital [8].
- 5 Minutes: A patient with severe internal or external bleeding can die in as little as 5 minutes without intervention [3].
- 11% Per Minute: Every minute delay in blood administration raises the risk of death by 11% due to organ failure from lack of oxygenated blood in the body [1].
- 37% Mortality Reduction: Prompt field administration of blood or blood products significantly boosts survival rates for crash victims. [4].
Key Impact: Trauma patients given whole blood in the field are 4x more likely to survive and require 60% less total blood during hospital treatment [1].
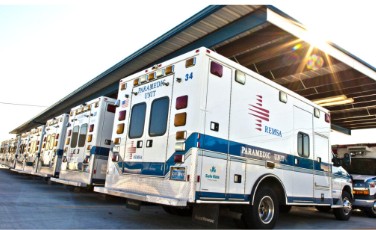
Figure 2: Paramedic unit vehicles in Nevada. Source: REMSA Health.
Nevada agencies are bringing whole blood directly to the scene of an emergency to save the lives of those involved in motor-vehicle crashes.
| Region | Program | Equipment & Process | Rotation/Waste Prevention |
| Southern Nevada | Clark County Fire Department (Launched December 2025) | Carried on quick-response vehicles in specialized coolers with portable blood warmers [5]. | Units nearing expiration are swapped for fresh blood and transferred to UMC Trauma Center for immediate use [6]. |
| Northern Nevada & Northeastern California | Care Flight Blood Stewardship (Launched May 2026) | Carried on helicopters and fixed-wing air ambulances for early transport transfusions. | Unused blood is returned to Renown Regional Medical Center approximately 1 week before expiration [7]. |
🚨 Crash Emergency: 5 Life-Saving Steps ⏱️
- CALL
- Contact emergency services immediately – Dial 911 right away after a serious crash or when someone suffers severe injuries.
- Contact emergency services immediately – Dial 911 right away after a serious crash or when someone suffers severe injuries.
- CONTROL
- Apply pressure if safe – If severe bleeding is visible, apply firm, continuous direct pressure directly to the wound using a clean cloth or dressing. Apply a tourniquet if significant extremity injury. Check out this visual for three ways to control bleeding.
- Apply pressure if safe – If severe bleeding is visible, apply firm, continuous direct pressure directly to the wound using a clean cloth or dressing. Apply a tourniquet if significant extremity injury. Check out this visual for three ways to control bleeding.
- DON’T MOVE
- Protect the spine and neck – Avoid moving a severely injured person unless there is an immediate environmental danger (such as fire).
- Protect the spine and neck – Avoid moving a severely injured person unless there is an immediate environmental danger (such as fire).
- FOLLOW
- Listen to trained dispatchers – Follow all instructions given by the 911 operator until EMS responders arrive on scene.
- Listen to trained dispatchers – Follow all instructions given by the 911 operator until EMS responders arrive on scene.
- SUPPORT
- Get trained and donate – Take a local bleeding control course and donate blood regularly to support local emergency inventory. Check out the community resources below.
Community Resources
Bleeding Control & First Aid Training – Learn basic skills for responding to life-threatening bleeding and other emergencies.
- Northern Nevada
- Rural Nevada Training Options: Check with your local health district, regional rural health office, or neighborhood fire and volunteer EMS departments to find in-person classes. For a flexible schedule, complete the course online through Stop the Bleed and schedule a hands-on skills sign-off with a local instructor.
Blood Donation – Find information about blood donation, eligibility, and donation opportunities.
References
- National Highway Traffic Safety Administration. Prehospital blood transfusion. Office of Emergency Medical Services. Accessed August 20, 2026. https://www.ems.gov/issues/prehospital-blood-transfusion/
- Berry, C., Gallagher, J. M., Goodloe, J. M., Dorlac, W. C., Dodd, J., & Fischer, P. E. (2023). Prehospital Hemorrhage Control and Treatment by Clinicians: A Joint Position Statement. Prehospital Emergency Care, 27(5), 544–551. https://doi.org/10.1080/10903127.2023.2195487
- Lagasse, P. (2026). National Stop the Bleed Month Spotlights Vital Lifesaving Skills. https://mrdc.health.mil/index.cfm/media/articles/2024/national_stop_the_bleed_month_spotlights_vital_lifesaving_skills
- National Volunteer Fire Council. New infographics highlight impact of EMS in post-crash care and prehospital blood transfusion. Published January 13, 2026. Accessed August 20, 2026. https://www.nvfc.org/new-infographics-highlight-impact-of-ems-in-post-crash-care-and-prehospital-blood-transfusion/
- Clark County Fire Department pilot program brings whole blood to emergency scenes. KVVU-TV Fox 5 Vegas. Published May 20, 2026. Accessed August 20, 2026. https://www.fox5vegas.com/2026/05/20/clark-county-fire-department-pilot-program-brings-whole-blood-emergency-scenes/
- Clark County Fire first in Nevada to carry whole blood to treat patients in the field. KLAS-TV 8 News Now. Published May 20, 2026. Accessed August 20, 2026. https://www.8newsnow.com/news/local-news/clark-county-fire-first-in-nevada-to-carry-whole-blood-to-treat-patients-in-the-field/
- Care Flight, Renown Health and Vitalant introduce blood programs to enhance life-saving care in flight. REMSA Health. Published April 30, 2026. Accessed August 20, 2026. https://www.remsahealth.com/news/care-flight-renown-health-and-vitalant-introduce-blood-program-to-enhance-life-saving-care-in-flight/
- National Highway Traffic Safety Administration. Post-crash care countermeasures: how to save more lives. Accessed September 17, 2026.https://www.ems.gov/assets/EMS-911-Post-Crash-Care-Countermeasures-Infographic_DIGITAL.pdf
This research was made possible by a grant from the Nevada Office of Traffic Safety #TS-2026-UNLV-1043.
Sign up to receive our Trends Newsletters by email!

GET IN TOUCH
