TREND 13.2 Distressed Communities and Transportation Insecurity: A Descriptive Analysis of Nevada Non-adjudicated Speeding Citations from 2018-2021
Nevada Traffic Research & Education Newsletter
May 13, 2024 // VOL. 13, ISSUE 02

Distressed Communities and Transportation Insecurity: A Descriptive Analysis of Nevada Non-adjudicated Speeding Citations from 2018-2021
By Noehealani Antolin, MPH; Ana Reyes, MS; Nicole Bacani; Kavita Batra, PhD, MPH, BDS, Bertille Mavegam Tango, MD, PhD; Deborah Kuhls, MD

Background Info
Drivers who are issued speeding citations and reside in distressed communities may face economic challenges, social disparities, and limited access to resources [1, 2]. Higher rates of citations in distressed communities may indicate challenges, such as restricted access to transportation alternatives or economic pressures that influence drivers to prioritize speed, for instance, over compliance with traffic laws. Additionally, the financial consequence of citations may create a situation where the citation recipient is unable to pay, and therefore, the citation escalates with more significant implications. To better understand the role of socioeconomic factors that may exist among those who receive traffic citations, this TREND newsletter will examine the co-existence of traffic speeding citations and the level of community distress based on the zip code of the citation recipient.
A validated metric to examine community distress is the Distressed Communities Index (DCI), which provides an evaluation of several contributing socioeconomic distress factors within communities [3]. The DCI ranks communities by zip code access across seven indicators: no high school diploma, housing vacancy, unemployed adults, poverty rate, median household income, change in employment and establishments, and calculates the averages of communities with these indicators into percentiles. The DCI scores range from 0 to 100 and are categorized into five quintiles based on their index scores: Prosperous (0-20.0), Comfortable (21.0-40.0), Mid-tier (41.0-60.0), At-risk (61.0-80.0), and Distressed (81.0-100.0). In addition to understanding socioeconomic distress within communities, assessing how these challenges impact transportation barriers is important. The US DOT’s Equitable Transportation Community (ETC) Explorer provides data that allows users to understand how a community is experiencing transportation disadvantages and transportation insecurity. Transportation insecurity occurs when individuals cannot safely and reliably get to and from places to meet their daily needs. It is evaluated at the county level across three transportation indicators: difficulty in reaching destinations (access), strain on household finances due to transportation expenses (cost burden), and the level of risk posed by motor vehicle crashes within a community (safety) [4]. Higher scores (65% or higher) on these indicators signify greater transportation disadvantage, highlighting challenges faced by communities.
Examining community distress levels and transportation barriers may help us understand socioeconomic factors that contribute to the transportation challenges in Nevadans. Exploring transportation access, affordability, and safety within distressed communities may help identify disparities and infrastructure gaps. This TREND is a descriptive analysis, and findings should not be used to draw conclusions about disparities and correlations.
Distressed Community Index (DCI)
We conducted a descriptive analysis to examine the intersection of non-adjudicated speeding citations with community distress levels, and transportation disadvantages and insecurity. From 2018 to 2021, 524,105 speeding citations were issued to drivers with in-state licenses. Among these citations, 150,454 or 28.7% were issued to drivers who resided in at-risk (17.6%) and distressed (11.1%) communities, based on their home zip codes (Figure 1). Considering the proportion of speeding citations issued to drivers residing in at-risk and distressed communities, it suggests the potential presence of limited financial resources among these individuals.
Figure 1. 2018-2021 NV Non-adjudicated Speeding Citations across DCI Levels

This map in Figure 2 categorizes distressed communities across Nevada by zip code into five levels of distress: Prosperous, Comfortable, Mid-Tier, At-Risk and Distressed, illustrating the varying socio-economic conditions experiences by residents across zip codes and counties.
Figure 2. Map of Distressed Communities Index (DCI) Levels by Zip Codes in Nevada. Counties are also demarcated.

In Clark County, 33.4% of speeding citations were issued to drivers residing in at-risk and distressed communities: [72,156 (19.2%) at-risk, and 53,437 (14.2%) distressed communities] (Figure 2a). As mentioned above, these percentages are based on the driver’s home zip code.
Figure 2a. Clark County Distressed Communities Index (DCI) levels by Zip Codes

Note: DCI Data source from 2016-2020.
Figure 2b depicts the distribution of DCI community quintiles – note the absence of distressed communities in Washoe County; 14,669 (20.9%) speeding citations were issued to drivers residing in at-risk communities.
Figure 2b. Washoe County Distressed Communities Index (DCI) levels by Zip code

Note: DCI data source from 2016-2020
In rural areas, for instance, Lyon County, 30.6% of speeding citations were issued to drivers residing in distressed and at-risk communities: [1,940 (12.9%) at-risk communities and 2,652 (17.7%) distressed communities] (Figure 2c).
Figure 2c. Carson City, Douglas, Lyon and Storey County Distressed Communities Index (DCI) by Zip code
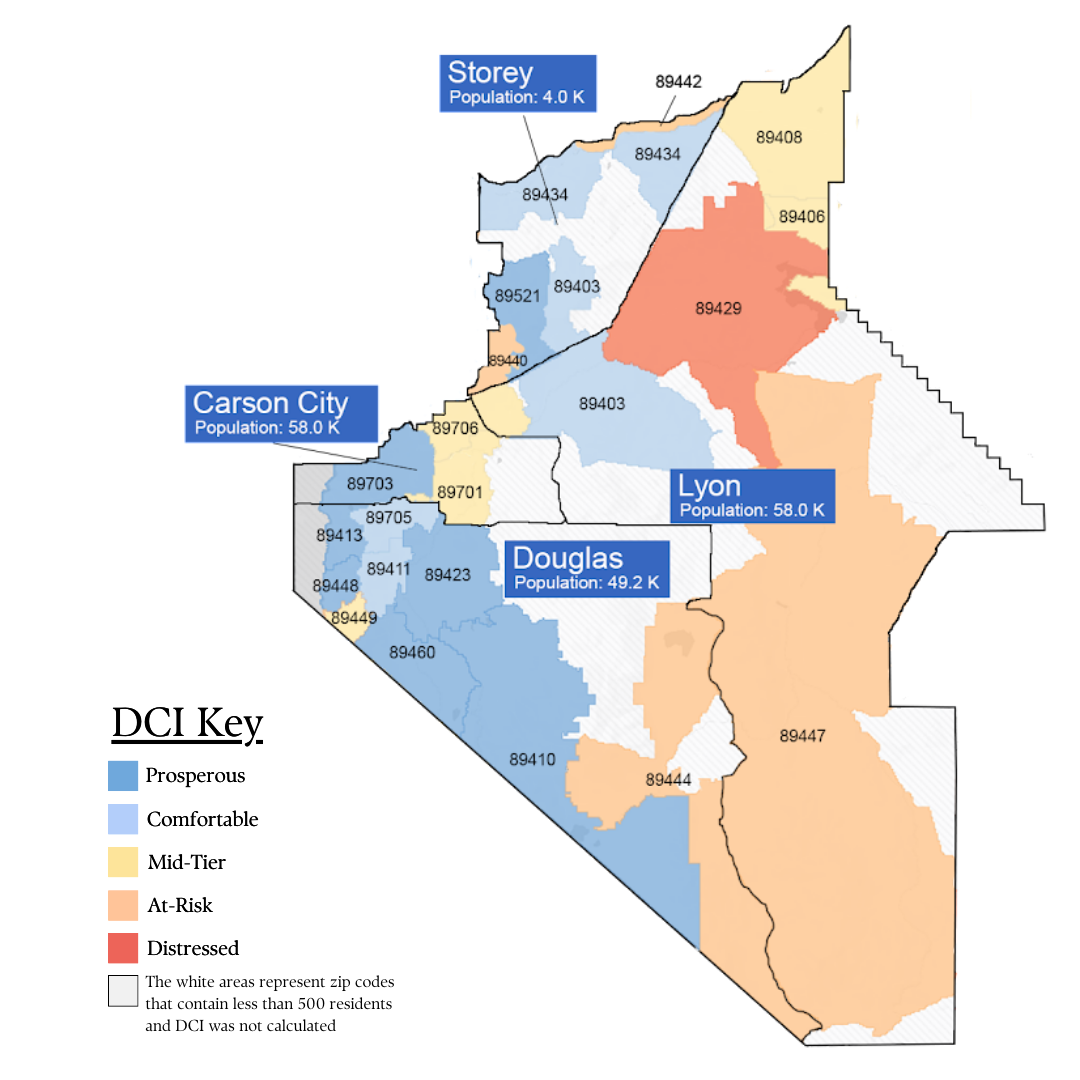
Note: DCI data source from 2016-2020
Equitable Transportation Community Tool
The ETC designates transportation insecurity at the county level, and when applied to Nevada, it reveals that 14 out of 16 counties experience high transportation insecurity (Table 1). The breakdown for each indicator is as follows:
- Transportation Access: 14 out of 16 counties experience high levels of transportation access issues
- Transportation Cost Burden: 4 out of 16 counties face significant transportation cost burdens
- Transportation Safety: 7 out of 16 counties encounter transportation safety concerns
Notably, while some urban counties (Clark and Washoe) display relatively lower levels of transportation insecurity, Carson City faced transportation access challenges. Rural counties such as Douglas, Lyon, and Storey also experienced high levels (65% or higher) of transportation access challenges. Additionally, Table 1 shows that several counties, such as Esmeralda, Eureka, Pershing, Lincoln, and Mineral, had high traffic fatalities per 100,000 persons due to motor vehicle crashes.
Table 1. Equitable Transportation Community (ETC) Tool: Transportation Insecurity among Nevada Drivers Issued Speeding Citations (2018-2021) by County (Disadvantage Threshold: 65% or Higher)

Note: 0% is considered the least disadvantaged, and 100% are the most disadvantaged. DOT considers a census tract to be experiencing a disadvantage if the overall index score places it in the 65% or higher (coded in red) of all US census tracts.
Conclusion
This descriptive analysis underscores the complex nature of transportation insecurity, socioeconomic distress, and speeding citations across Nevada’s communities. Speeding citations issued to drivers residing in distressed communities highlight patterns of non-compliance with speed limits, and may signal underlying challenges such as limited transportation access and economic pressures. Addressing these challenges requires a comprehensive approach that considers the unique circumstances of each community, including their economic status and geographic location. By understanding the economic distress levels, transportation insecurity, and the prevalence of speeding citations in Nevada communities, stakeholders can work towards implementing target interventions to improve transportation access, safety, and compliance with traffic laws.
Data was received from the Nevada Office of Traffic Safety, and this research was made possible by a grant from the Nevada Office of Traffic Safety #TS-2023-UNLV- 00077.
References
- Mello S. Speed trap or poverty trap? Fines, fees, and financial wellbeing. Work. Pap: FFJC. November:2018. Accessed March 19, 2024. https://thenewspaper.com/rlc/docs/2019/fl-ticketimpact.pdf
- Santiago CD, Wadsworth ME, Stump J. Socioeconomic status, neighborhood disadvantage, and poverty-related stress: Prospective effects on psychological syndromes among diverse low-income families. Journal of Economic Psychology. 2018;32:2:218–230. https://doi.org/10.1016/j.joep.2009.10.008
- Economic Innovation Group: Distressed Communities Index. https://eig.org/distressed-communities/?geo=states&lat=38.01&lon=-96.42&z=4&showAbout=true Accessed March 18, 2024.
- United States Department of Transportation: Equitable Transportation
Community Explorer. https://experience.arcgis.com/experience/0920984aa80a4362b8778d779b090723/
page/Understanding-the-Data/ Accessed March 18, 2024
Infographics (coming soon)
Signup to receive our TREND newsletters by email

GET IN TOUCH